
The realist in me is amazed that the Invesco QQQ ETF (QQQ) is so resilient. But a moment later, I snap out of it, and remind myself, “it’s the passive flow and the high level of market liquidity.” In other words, as long as 401k money floods into mega-cap-biased index funds and central bank money-pumping continues as it has for years, there’s no reason QQQ can’t keep climbing.
Or, it could go the way of the dot-com bubble, specifically the calendar year 2000. If you’re not familiar, here’s an easy way to remember it. Because if you do, you’ll be a risk manager like me, forever.
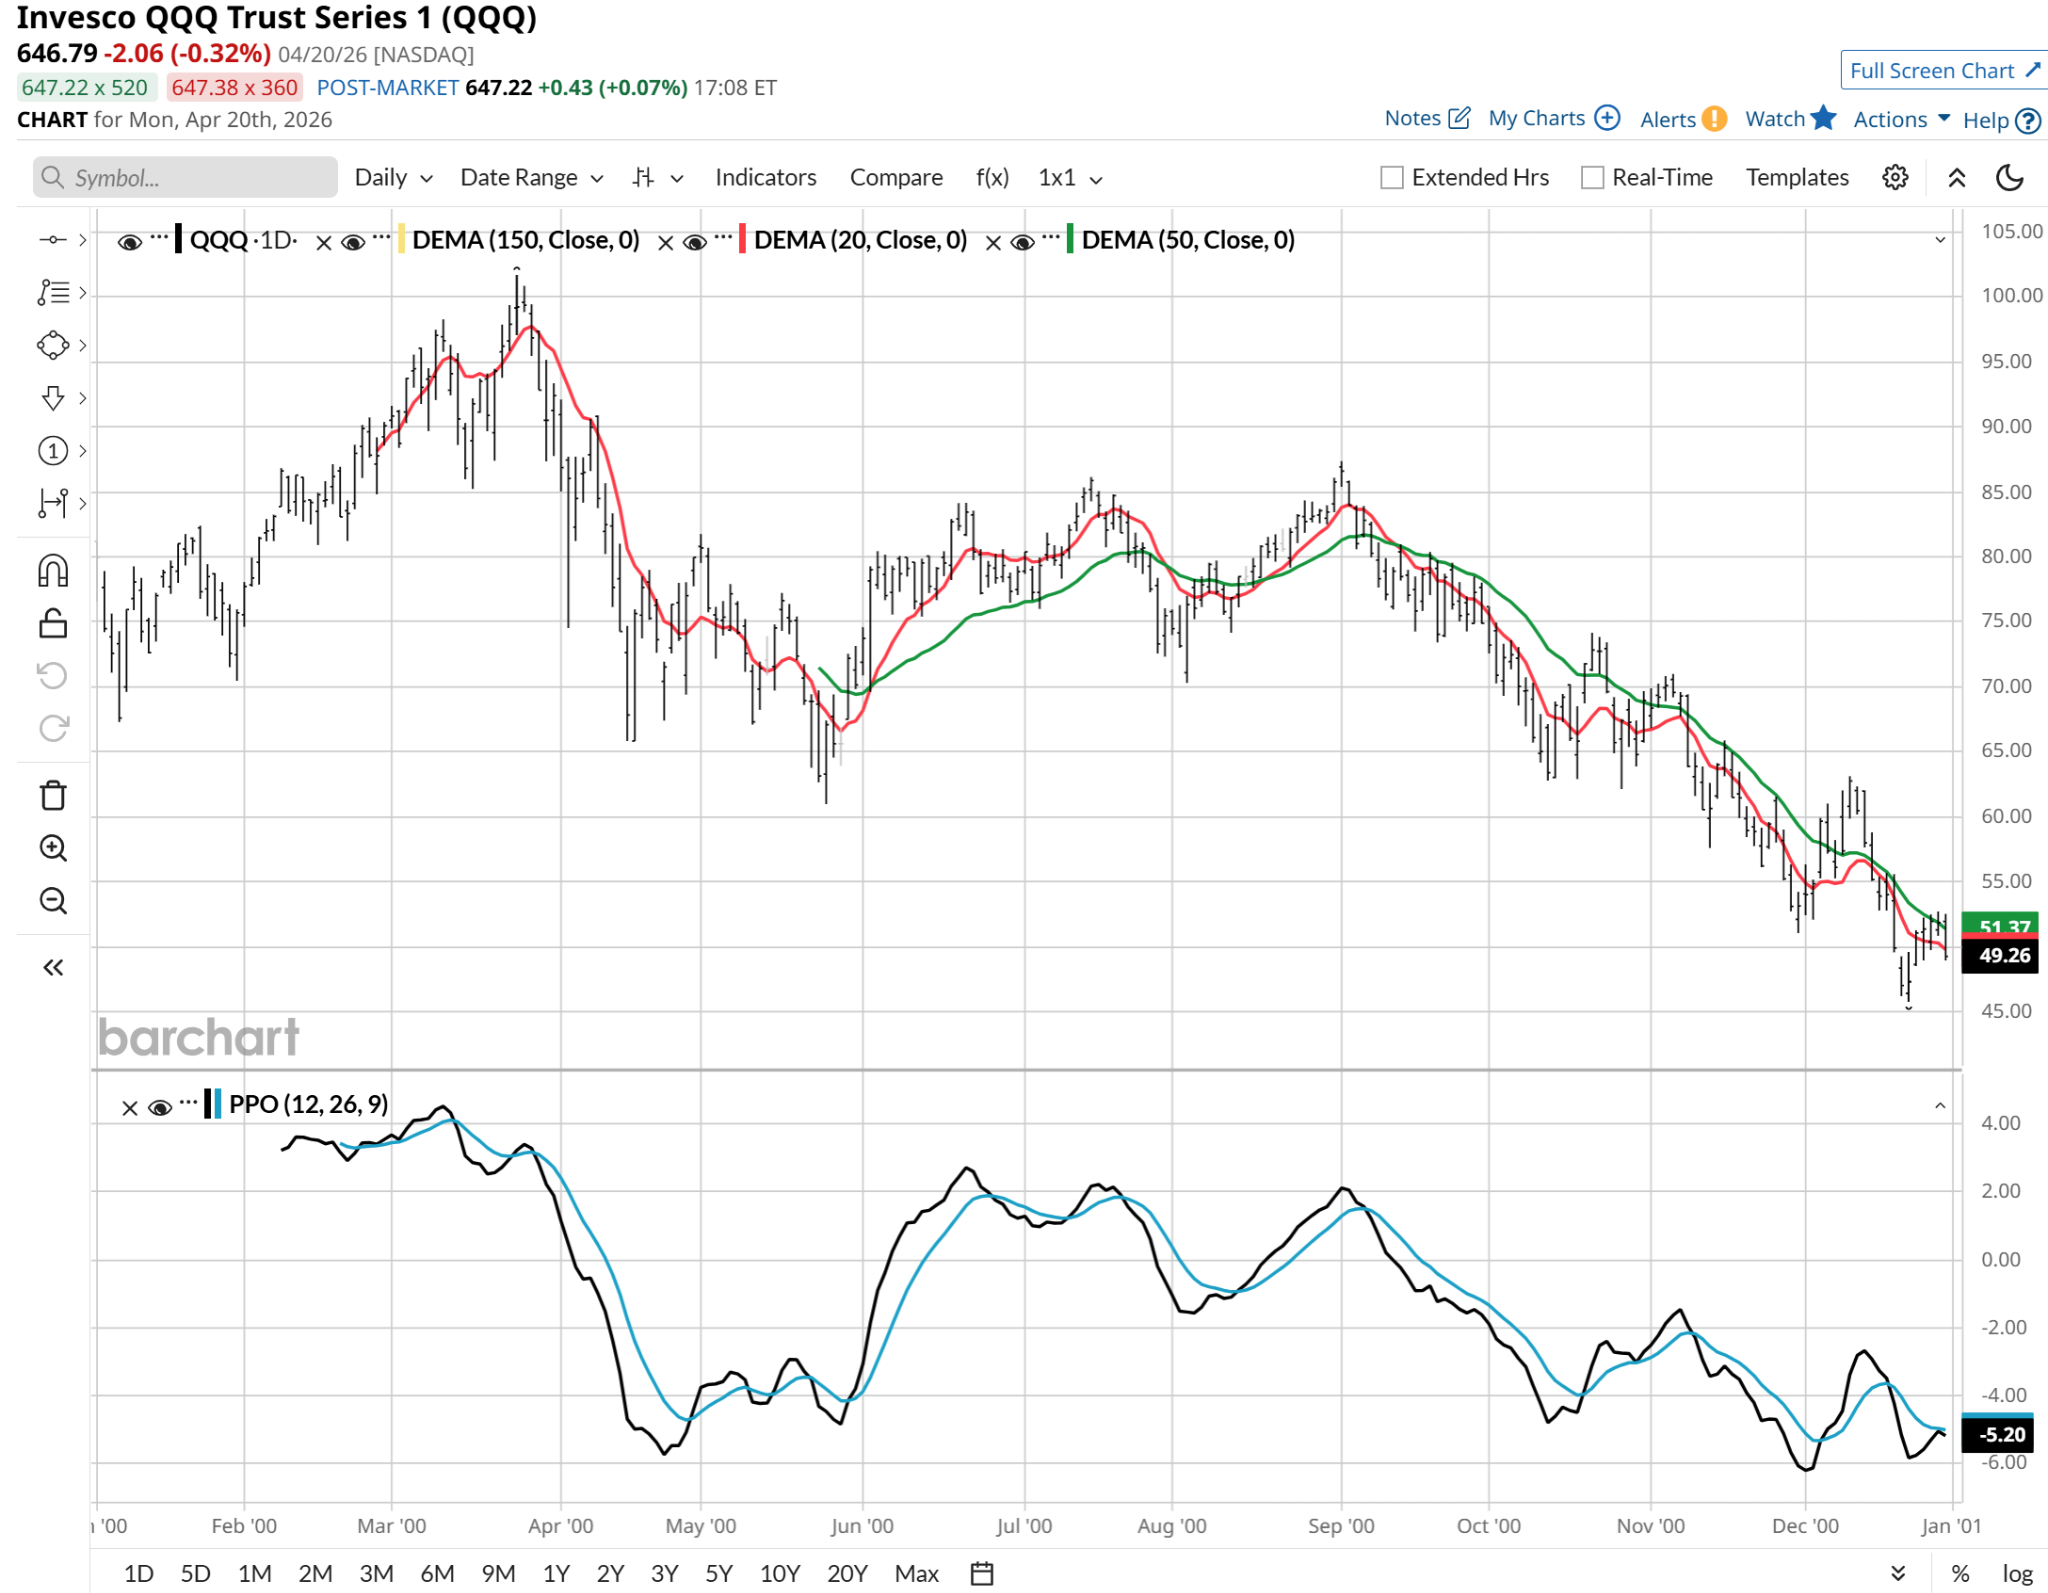
During the year 2000, QQQ rose by 50% at one point early in the year, topping out at around $100 a share in late March. It closed the year just below $50. Yes, a 50% gain AND 50% loss within the same year! Here, see for yourself.
Is QQQ Acting Like It Did Before the Dot-Com Bubble Burst?
Yes and no. There is a similar air of invincibility, specifically among investors who have never seen a bear market. That was also the case in 2000, since the last one we’d had was 1990, and before that, in 1987.
The crash that year dropped the market by more than 20% in a single day. And while investors en masse swore off equities “forever” at that moment, it did not take very long to recover. If this sounds like the past several years, you’re in sync with me here. It doesn’t have to repeat, just rhyme. And I am NOT about predicting the future, just preparing for a wide range of possible outcomes.
That brings us to today, where we find that QQQ has arrived at a critical junction.
After an aggressive run that propelled the index back toward previous levels, the current market structure is a classic technical standoff. Whether this move represents a blowoff top (the final surge before a reversal) or a legitimate breakout depends on the sustainability of recent volume and momentum.
Above, I showed you a 12-month chart of QQQ, all 12 months of the year 2000. Here is the past 12 months of QQQ through Monday’s close.
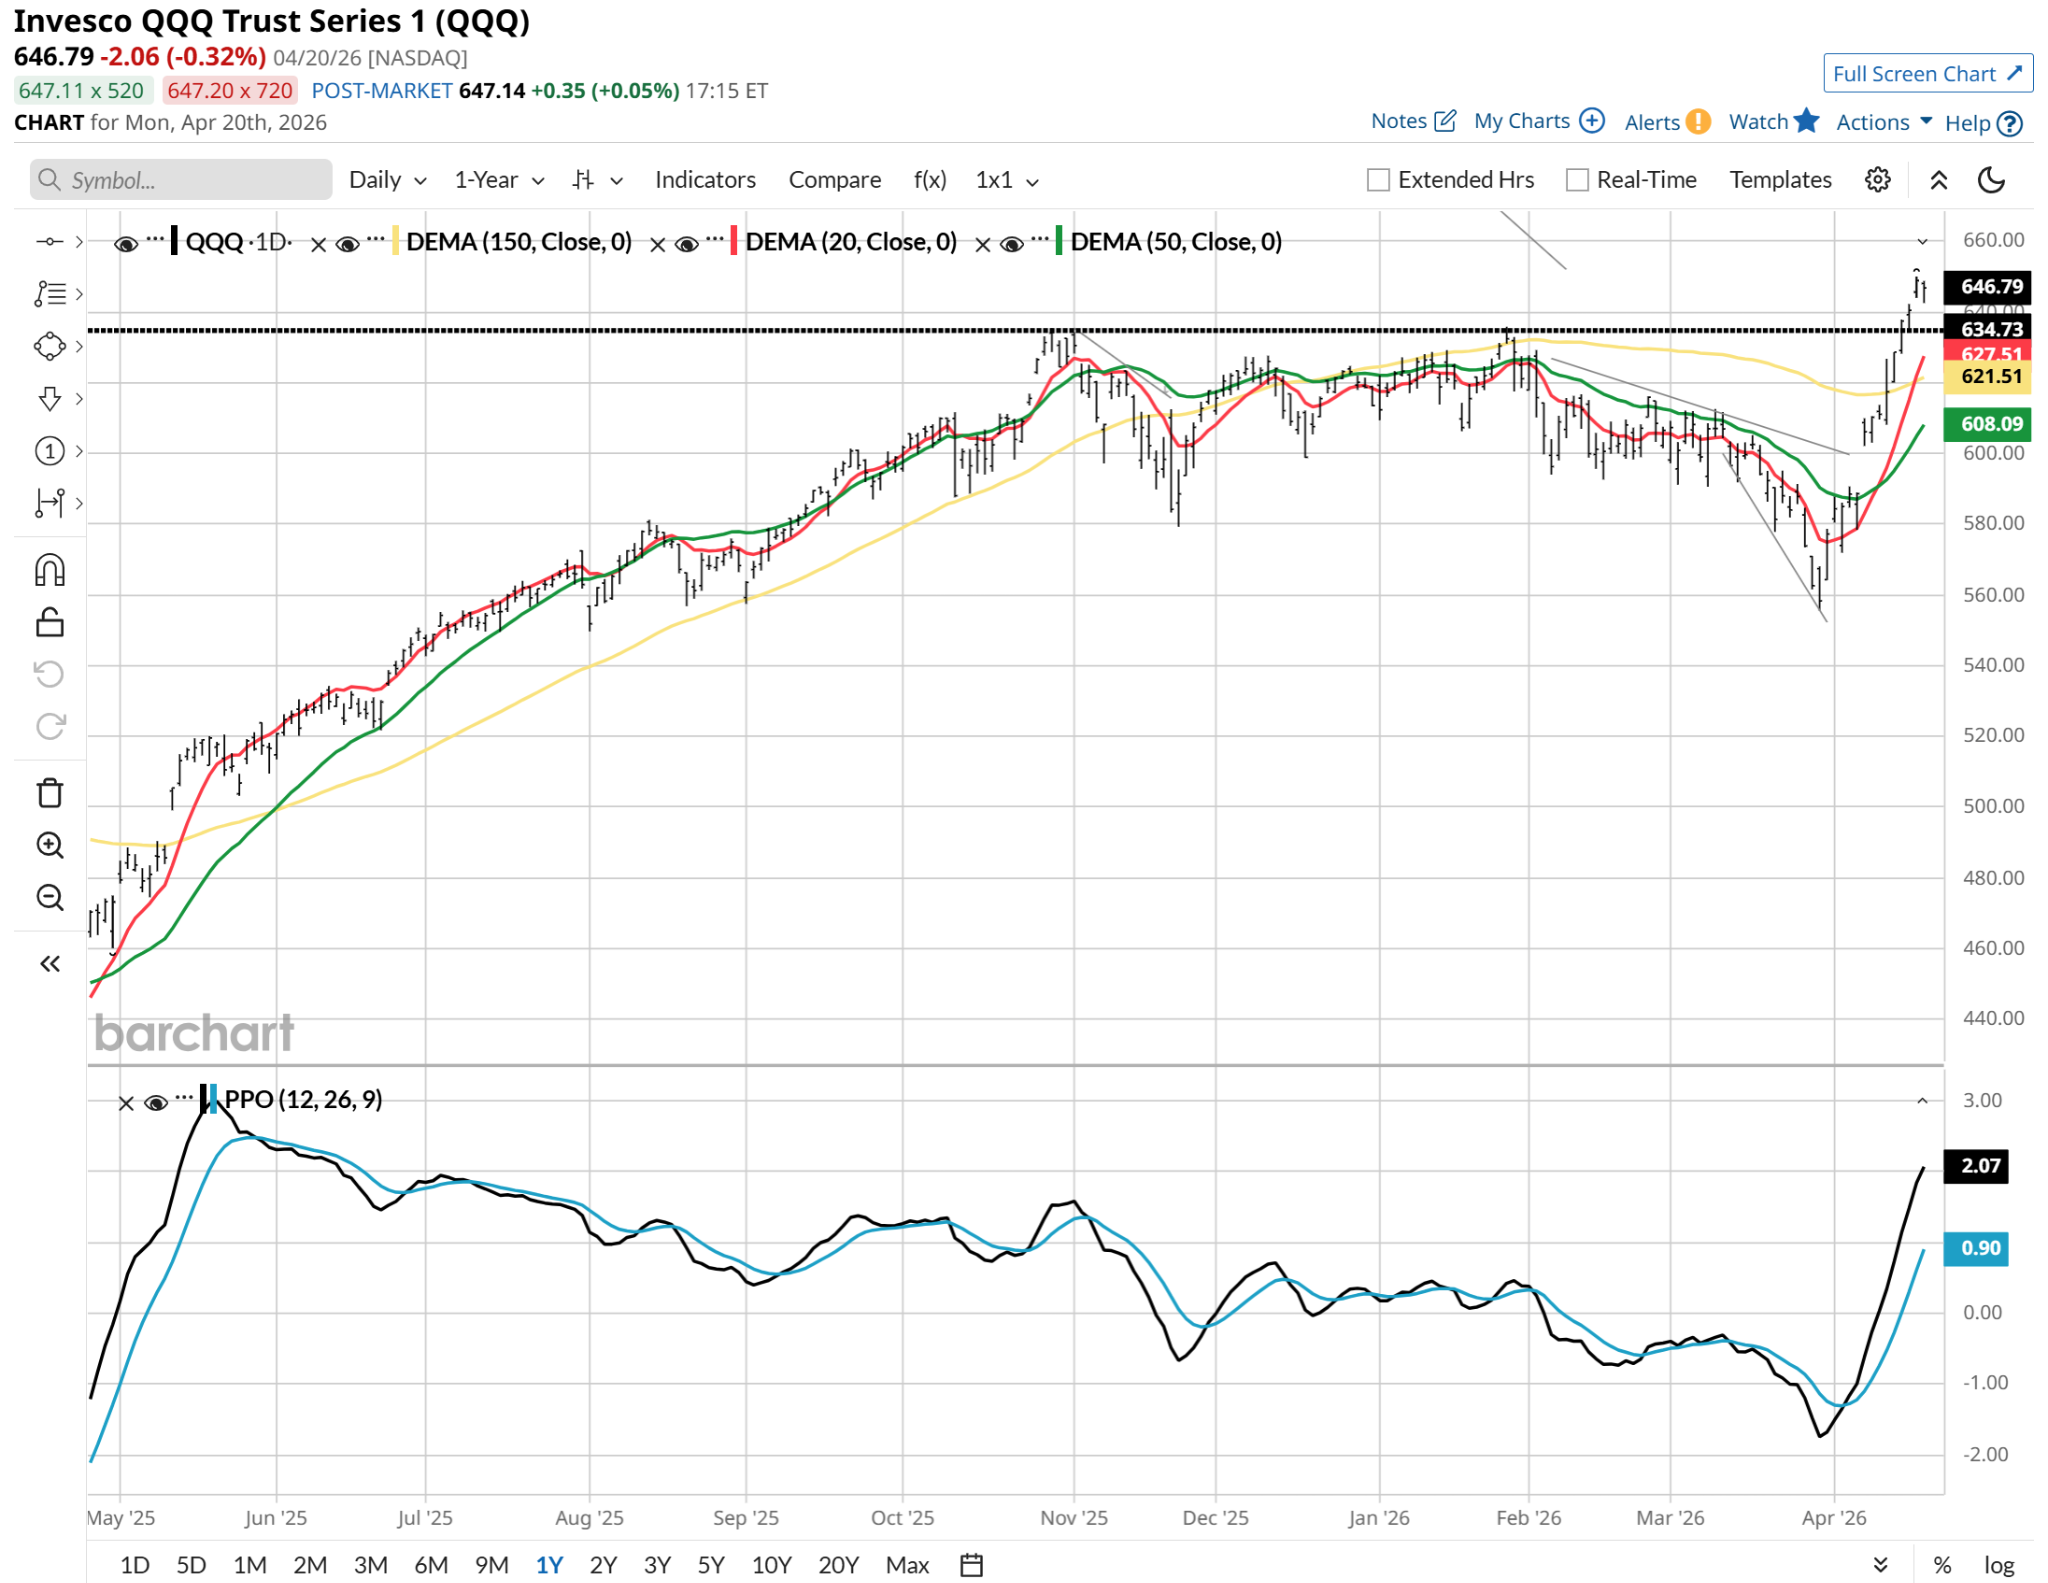
I do not see a carbon copy of 2000 here. But that’s not really what I’d expect. The markets are so different 26 years later. It is the spirit, the raw excitement, that has me thinking there’s a bear on the loose.
And for good measure, I was recently at a routine checkup at the doctor’s office, and what did I hear? The office staff, talking about how they wanted to get into day trading, like their rich friends. I’m just saying.
The Case for a Blowoff Top
The argument for a blowoff top is centered on the rapid, vertical nature of the recent move during a period of significant macro uncertainty.
Many of the top components in the QQQ are approaching previous resistance levels on thinning volume. In technical terms, a price surge without volume support is often a sign of a “liquidity grab” before a sharp mean-reversion. Momentum indicators for the QQQ are currently pushed into extreme territory.
Percentage price oscillator (PPO) is the main one I’m tracking (bottom of the above charts). That’s quite a recent spike higher. Historically, when the index maintains these levels without a healthy consolidation, the eventual correction tends to be swift and severe.
The Case for a Technical Breakout
Conversely, proponents of a continued rally argue that the market has fundamentally reset. And I see their point.
Unlike previous speculative cycles, the recent gains in the QQQ are backed by substantial earnings performance from the dominant technology and AI-related names. Put it all together, and I’d say QQQ is currently facing a pretty high-stakes moment here.
The current market is essentially a tug of war between rapid price appreciation and the same underlying caution I continue to have about the structure of the major U.S. stock indexes. Too top-heavy! And thus, masking the meandering underneath.
Rob Isbitts created the ROAR Score, based on his 40+ years of technical analysis experience. ROAR helps DIY investors manage risk and create their own portfolios. For Rob’s written research, check out ETFYourself.com.
On the date of publication, Rob Isbitts did not have (either directly or indirectly) positions in any of the securities mentioned in this article. All information and data in this article is solely for informational purposes. For more information please view the Barchart Disclosure Policy here.
More news from Barchart
- Dear MaxLinear Stock Fans, Mark Your Calendars for April 23
- SanDisk: Is a 20x Surge Just the Beginning or a Peak for This AI Pure-Play?
- Mizuho Analysts Are Bullish on Custom Chips: Broadcom Could Have 87% Compound Annual Growth Rate Through 2028
- Catching the Falling Knife: Are These 4 Loser Stocks Down 50% or More Worth the Risk?